elk之kibana 查询使用

通过在搜索栏输入搜索条件,您可以在匹配当前索引模式的索引中进行搜索。您可以进行简单的文本查询,或使用 Lucene 语法,或使用基于 JSON 的 Elasticsearch 查询 DSL。

下面是一些lucene语法的简易查询条件:

  • You can search any field by typing the field name followed by a colon “:” and then the term you are looking for.
title:"The Right Way" AND text:go
title:"Do it right" AND right
  • Wildcard Searches 通配符查找

The single character wildcard search looks for terms that match that with the single character replaced. For example, to search for “text” or “test” you can use the search:

  • where the status field contains active
status:active
  • where the title field contains quick or brown. If you omit the OR operator the default operator will be used
title:(quick OR brown)
title:(quick brown)
  • where the author field contains the exact phrase "john smith"
author:"John Smith"
  • Regular expression patterns can be embedded in the query string by wrapping them in forward-slashes ("/"):
name:/joh?n(ath[oa]n)/
  • Ranges can be specified for date, numeric or string fields. Inclusive ranges are specified with square brackets [min TO max] and exclusive ranges with curly brackets {min TO max}.
count:[1 TO 5]
date:[2012-01-01 TO 2012-12-31]
Dates before 2012
date:{* TO 2012-01-01}
  • 时间范围查询
created:["2020-06-15 22:00:00" TO "2020-06-16 10:00:00"]
GET /index/type/_search
{
  "query": {
    "range": {
      "created": {
        "gte": "2020-06-14 09:00:00",
        "lte": "2020-06-14 10:00:00"
      }
    }
  }
}
  • 编辑距离(莱文斯坦距离):

We can search for terms that are similar to, but not exactly like our search terms, using the “fuzzy” operator:

quikc~ brwn~ foks~

This uses the Damerau-Levenshtein distance to find all terms with a maximum of two changes, where a change is the insertion, deletion or substitution of a single character, or transposition of two adjacent characters.

The default edit distance is 2, but an edit distance of 1 should be sufficient to catch 80% of all human misspellings. It can be specified as:

quikc~1
  • 查询栏大小比较举例
account_number:<100 AND balance:>47500

刷新搜索结果:

  1. 点击 Kibana 工具栏中的 Time Picker  。
  2. 点击 Auto refresh 。
  3. 在列表中选择刷新频率。
自动刷新设置

根据字段过滤

从 Fields 列表中添加一个过滤器:

  • 点击想要过滤的字段名。这里显示了该领域最常用的五个字段值
字段过滤
  • 添加积极过滤器(上图的加号图标),请点击 Positive Filter 按钮 
  • 添加消极过滤器(上图的减号图标),请点击 Negative Filter 按钮

管理过滤器: 修改一个过滤器,请将鼠标置于该过滤器,然后点击某个操作按钮

过滤器

elk之logstash初体验

  • logstash是什么?

官网的一句话:logstash是免费且开放的服务器端数据处理管道,能够从多个来源采集数据,转换数据,然后将数据发送到您喜欢的”存储库”中,这个存储库通常是es.

  • logstash的作用是?

Logstash 能够动态地采集,转换和传输数据,不受格式或复杂度的影响。说白了,就是可以采集数据,过滤数据,并输出的这样一个工具。

  • 既然logstash和filebeat都有数据采集功能,那为什么通常的数据链路是:filebeat->logstash->(kafaka)->es,为什么不直接去掉filebeat这一层,直接用logstash收集加过滤处理?

这就要说到elk的一些历史:
因为logstash是jvm跑的,资源消耗比较大,所以后来作者又用golang写了一个功能较少但是资源消耗也小的轻量级的logstash-forwarder。
不过作者只是一个人,加入http://elastic.co公司以后,因为es公司本身还收购了另一个开源项目packetbeat,而这个项目专门就是用golang的,有整个团队,所以es公司干脆把logstash-forwarder的开发工作也合并到同一个golang团队来搞,于是新的项目就叫filebeat了。
究其原因是:性能问题加上项目历史的一些原因。
所以最后一般是filebeat做采集,logstash 做数据处理和过滤

  • 说了这么多,我们来安装一下logstash
#检查jdk环境,需要jdk1.8+
java -version

#解压安装包
tar -xvzf logstash-6.2.4.tar.gz
  • 在聊示例之前,再聊一会儿logstash的理论

A Logstash pipeline has two required elements, input and output, and one optional element, filter. The input plugins consume data from a source, the filter plugins modify the data as you specify, and the output plugins write the data to a destination.

以上是elk 官网的一段logstash介绍,大致意思是说:logstash流水线分两个必需的元素,输入和输出,以及一个可选元素:过滤器,输出组件从源头消费数据,过滤组件按你指定的方式修改数据,输出组件写数据到目标位置

logstash pipeline

现在我们来看下上面第一个示例:输入是stdin, 输出是标准输出

#第一个logstash示例
bin/logstash -e 'input {stdin {}} output {stdout {}}'

The -e flag enables you to specify a configuration directly from the command line. Specifying configurations at the command line lets you quickly test configurations without having to edit a file between iterations. The pipeline in the example takes input from the standard input, stdin, and moves that input to the standard output, stdout, in a structured format.

上面这段的意思大概是说 -e参数/标识 使得你能够直接从命令行指定配置,通过命令行指定配置能够让你快速测试配置,不用编辑文件,上面的例子是流水线从标准输入接收,然后从标准输出打印输出

[root@VM_IP_centos logstash-6.2.4]# bin/logstash -e 'input {stdin {}} output {stdout {}}'
Sending Logstash's logs to /opt/logstash-6.2.4/logs which is now configured via log4j2.properties
[2020-06-14T11:16:12,913][INFO ][logstash.modules.scaffold] Initializing module {:module_name=>"netflow", :directory=>"/opt/logstash-6.2.4/modules/netflow/configuration"}
[2020-06-14T11:16:12,944][INFO ][logstash.modules.scaffold] Initializing module {:module_name=>"fb_apache", :directory=>"/opt/logstash-6.2.4/modules/fb_apache/configuration"}
[2020-06-14T11:16:13,090][INFO ][logstash.setting.writabledirectory] Creating directory {:setting=>"path.queue", :path=>"/opt/logstash-6.2.4/data/queue"}
[2020-06-14T11:16:13,103][INFO ][logstash.setting.writabledirectory] Creating directory {:setting=>"path.dead_letter_queue", :path=>"/opt/logstash-6.2.4/data/dead_letter_queue"}
[2020-06-14T11:16:13,892][WARN ][logstash.config.source.multilocal] Ignoring the 'pipelines.yml' file because modules or command line options are specified
[2020-06-14T11:16:13,975][INFO ][logstash.agent           ] No persistent UUID file found. Generating new UUID {:uuid=>"a7b8baba-eebb-409c-9aa9-6173a492a1ec", :path=>"/opt/logstash-6.2.4/data/uuid"}
[2020-06-14T11:16:15,028][INFO ][logstash.runner          ] Starting Logstash {"logstash.version"=>"6.2.4"}
[2020-06-14T11:16:15,758][INFO ][logstash.agent           ] Successfully started Logstash API endpoint {:port=>9600}
[2020-06-14T11:16:19,293][INFO ][logstash.pipeline        ] Starting pipeline {:pipeline_id=>"main", "pipeline.workers"=>1, "pipeline.batch.size"=>125, "pipeline.batch.delay"=>50}
[2020-06-14T11:16:19,514][INFO ][logstash.pipeline        ] Pipeline started successfully {:pipeline_id=>"main", :thread=>"#<Thread:0x6dbc2611 run>"}
The stdin plugin is now waiting for input:
[2020-06-14T11:16:19,722][INFO ][logstash.agent           ] Pipelines running {:count=>1, :pipelines=>["main"]}
hello world
{
          "host" => "VM_16_5_centos",
    "@timestamp" => 2020-06-14T03:23:11.693Z,
      "@version" => "1",
       "message" => "hello world"
}
  • 配置一个简单的logstash, 输入是标准输入stdin, 输出是es
input { stdin { } }
output {
  elasticsearch { hosts => ["localhost:9200"] }
  stdout { codec => rubydebug }
}
bin/logstash -f logstash-simple.conf

When you run logstash, you use the -f to specify your config file. (用f参数来指定logstash的配置文件),接下来我们来测试一下:

hhhh
{
    "@timestamp" => 2020-06-14T04:29:44.247Z,
      "@version" => "1",
          "host" => "VM_IP_centos",
       "message" => "hello world sworldhhhh"
}
logstash test
{
    "@timestamp" => 2020-06-14T04:30:24.210Z,
      "@version" => "1",
          "host" => "VM_IP_centos",
       "message" => "logstash test"
}

我在命令行终端输入两次,一次“hello world sworldhhhh”, 一次“logstash test”

kibana的查询结果

A Logstash config file has a separate section for each type of plugin you want to add to the event processing pipeline. For example:

# This is a comment. You should use comments to describe
# parts of your configuration.
input {
  ...
}

filter {
  ...
}

output {
  ...
}
  • 接下来我们将读取从标准输入换成从文件读取

Logstash 使用一个名叫 FileWatch 的 Ruby Gem 库来监听文件变化。这个库支持 glob 展开文件路径,而且会记录一个叫 .sincedb 的数据库文件来跟踪被监听的日志文件的当前读取位置。所以,不要担心 logstash 会漏过你的数据。

input
    file {
        path => ["/var/log/*.log", "/var/log/message"]
        type => "system"
        start_position => "beginning"
    }
}

input负责从数据源提取数据,由于我提取的是日志文件,所以使用的是file插件,该插件常用的几个参数是:

path:指定日志文件路径。
type:指定一个自定义名称,设置type后,可以在后面的filter和output中对不同的type做不同的处理,适用于需要消费多个日志文件的场景。
start_position:指定起始读取位置,“beginning”表示第一次启动从文件头开始读取,后面动态读取;“end”表示从文件尾开始(类似tail -f)。
sincedb_path:sincedb_path 指定sincedb文件的路径。sincedb保存每个日志文件已经被读取到的位置,如果Logstash重启,对于同一个文件,会继续从上次记录的位置开始读取。如果想重新从头读取文件,需要删除sincedb文件。如果设置为“/dev/null”,即不保存位置信息。

Elk之Filebeat初探

  • 什么是Filebeat?

Filebeat是Beat成员之一,基于Go语言,无任何依赖,并且比logstash更加轻量,非常适合安装在生产机器上,不会带来过高的资源占用,轻量意味着简单,所以Filebeat主要作用是将收集的日志原样上报。

  • Filebeat的作用是?

Filebeat的作用主要是用于转发和汇总日志与文件

  • Filebeat的应用场景?

我们要查看应用的一些log, 比如nginx log, php error log, mysql 的一些log, 我们往往需要登录到服务器上(或者我们没有权限登录服务器),而是让运维把log传给我们,我们再去查看,如果服务器的数量比较少的话,还比较容易操作,但是如果服务器的数量成百上千的话,那这个拿日志的操作就比较繁琐了。如果我们使用Filebeat后,我们可以把filebeat部署到应用的每台机器上,它就可以帮我们收集服务器上的各种log, 然后在我们的可视化界面当中展示出来,这就是filebeat主要的作用

Filebeat内置了很多模块(auditd, Apache, nginx, system, mysql等等),可针对常见格式的日志大大简化收集、解析和可视化过程,只要一条命令即可。

Filebeat 不会导致管道过载,以下是官网的一段介绍:

当将数据发送到 Logstash 或 Elasticsearch 时,Filebeat 使用背压敏感协议,以应对更多的数据量。如果 Logstash 正在忙于处理数据,则会告诉 Filebeat 减慢读取速度。一旦拥堵得到解决,Filebeat 就会恢复到原来的步伐并继续传输数据。

Filebeat架构:

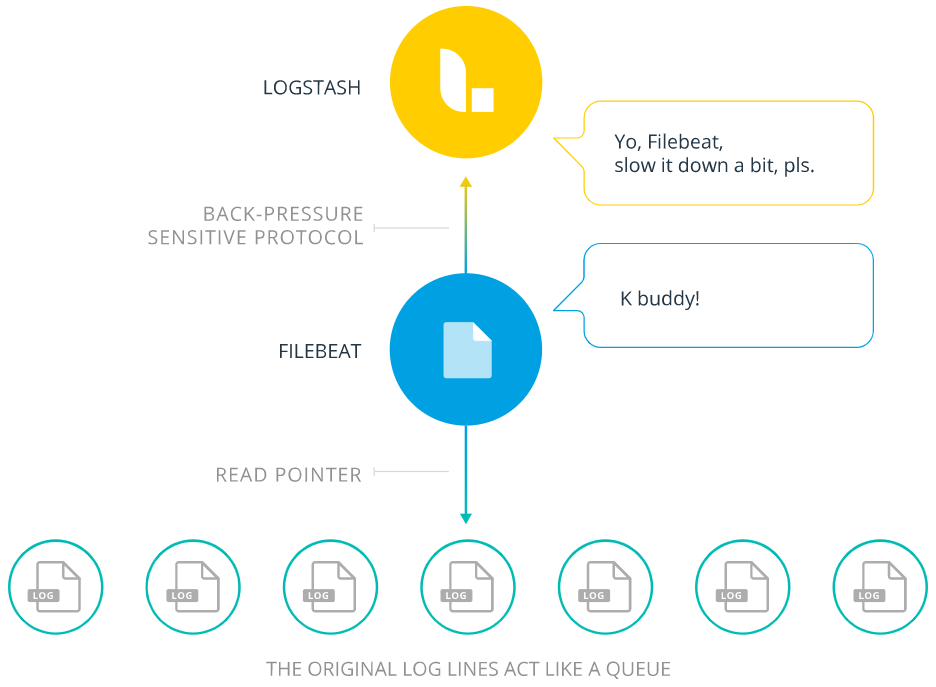
Here’s how Filebeat works: When you start Filebeat, it starts one or more inputs that look in the locations you’ve specified for log data. For each log that Filebeat locates, Filebeat starts a harvester(中文被翻成收割机). Each harvester reads a single log for new content and sends the new log data to libbeat, which aggregates the events and sends the aggregated data to the output that you’ve configured for Filebeat.

What is a harvester?

A harvester is responsible for reading the content of a single file. The harvester reads each file, line by line, and sends the content to the output. One harvester is started for each file. The harvester is responsible for opening and closing the file, which means that the file descriptor remains open while the harvester is running. If a file is removed or renamed while it’s being harvested, Filebeat continues to read the file. This has the side effect that the space on your disk is reserved until the harvester closes. By default, Filebeat keeps the file open until close_inactive is reached.

部署与运行?

下载: https://www.elastic.co/cn/downloads/past-releases#filebeat

cd /opt/
tar -xvzf filebeat-6.2.4-linux-x86_64.tar.gz

[root@VM_IP_centos opt]# cd filebeat-6.2.4/
[root@VM_IP_centos filebeat-6.2.4]# ls -lh
total 48M
-rw-r--r--  1 root root  44K Apr 13  2018 fields.yml
-rwxr-xr-x  1 root root  47M Apr 13  2018 filebeat
-rw-r-----  1 root root  51K Apr 13  2018 filebeat.reference.yml
-rw-------  1 root root 7.1K Apr 13  2018 filebeat.yml
drwxrwxr-x  4 www  www  4.0K Apr 13  2018 kibana
-rw-r--r--  1 root root  583 Apr 13  2018 LICENSE.txt
drwxr-xr-x 14 www  www  4.0K Apr 13  2018 module
drwxr-xr-x  2 root root 4.0K Apr 13  2018 modules.d
-rw-r--r--  1 root root 187K Apr 13  2018 NOTICE.txt
-rw-r--r--  1 root root  802 Apr 13  2018 README.md
  • 下面我们来配置下filebeat, 先让他从标准输入(键盘)接收数据
cp /opt/filebeat-6.2.4/filebeat.yml /opt/filebeat-6.2.4/test.yml
vim test.yml
filebeat.prospectors:
- type: stdin
  enabled: true
output.console:
  pretty: true
  enable: true

type: 指定输入类型,可以是stdin, 也可以是log(文件),可以指定多个input, enable表示是是否启用

output.console. 表示是否启用终端输出

  • 启动filebeat和测试效果
[root@VM_IP_centos filebeat-6.2.4]# ./filebeat -e -c test.yml 
2020-06-13T06:40:22.290+0800	INFO	instance/beat.go:468	Home path: [/opt/filebeat-6.2.4] Config path: [/opt/filebeat-6.2.4] Data path: [/opt/filebeat-6.2.4/data] Logs path: [/opt/filebeat-6.2.4/logs]
2020-06-13T06:40:22.290+0800	INFO	instance/beat.go:475	Beat UUID: d29dba4a-be63-483a-8d15-35d78f1fa68e
2020-06-13T06:40:22.290+0800	INFO	instance/beat.go:213	Setup Beat: filebeat; Version: 6.2.4
2020-06-13T06:40:22.290+0800	INFO	pipeline/module.go:76	Beat name: VM_16_5_centos
2020-06-13T06:40:22.290+0800	INFO	instance/beat.go:301	filebeat start running.
2020-06-13T06:40:22.290+0800	INFO	registrar/registrar.go:73	No registry file found under: /opt/filebeat-6.2.4/data/registry. Creating a new registry file.
2020-06-13T06:40:22.291+0800	INFO	[monitoring]	log/log.go:97	Starting metrics logging every 30s
2020-06-13T06:40:22.298+0800	INFO	registrar/registrar.go:110	Loading registrar data from /opt/filebeat-6.2.4/data/registry
2020-06-13T06:40:22.298+0800	INFO	registrar/registrar.go:121	States Loaded from registrar: 0
2020-06-13T06:40:22.298+0800	WARN	beater/filebeat.go:261	Filebeat is unable to load the Ingest Node pipelines for the configured modules because the Elasticsearch output is not configured/enabled. If you have already loaded the Ingest Node pipelines or are using Logstash pipelines, you can ignore this warning.
2020-06-13T06:40:22.298+0800	INFO	crawler/crawler.go:48	Loading Prospectors: 1
2020-06-13T06:40:22.298+0800	INFO	crawler/crawler.go:82	Loading and starting Prospectors completed. Enabled prospectors: 1
2020-06-13T06:40:22.298+0800	INFO	log/harvester.go:216	Harvester started for file: -

#Harvester started for file 表示filebeat已经启动 
hello #这里是我在命令行的一个输入
{
  "@timestamp": "2020-06-12T22:40:38.439Z",
  "@metadata": {
    "beat": "filebeat",
    "type": "doc",
    "version": "6.2.4"
  },
  "message": "hello",
  "prospector": {
    "type": "stdin"
  },
  "beat": {
    "name": "VM_IP_centos",
    "hostname": "VM_IP_centos",
    "version": "6.2.4"
  },
  "source": "",
  "offset": 6
}
#filebeat两个启动参数
-c, --c string             Configuration file, relative to path.config (default "filebeat.yml")
       --cpuprofile string    Write cpu profile to file
-e, --e                    Log to stderr and disable syslog/file output (输出到标准输出,默认输出到syslog和logs下)
-d, -d "publish" 输出debug信息
  • 读取文件
filebeat.prospectors:
- type: log
  enabled: true
  paths:
    - /tmp/logs/*.log
output.console:
  pretty: true
  enable: true
#启动
[root@VM_IP_centos filebeat-6.2.4]# ./filebeat -e -c test.yml 
2020-06-13T07:06:49.189+0800	INFO	instance/beat.go:468	Home path: [/opt/filebeat-6.2.4] Config path: [/opt/filebeat-6.2.4] Data path: [/opt/filebeat-6.2.4/data] Logs path: [/opt/filebeat-6.2.4/logs]
2020-06-13T07:06:49.189+0800	INFO	instance/beat.go:475	Beat UUID: d29dba4a-be63-483a-8d15-35d78f1fa68e
2020-06-13T07:06:49.189+0800	INFO	instance/beat.go:213	Setup Beat: filebeat; Version: 6.2.4
2020-06-13T07:06:49.190+0800	INFO	pipeline/module.go:76	Beat name: VM_16_5_centos
2020-06-13T07:06:49.190+0800	INFO	instance/beat.go:301	filebeat start running.
2020-06-13T07:06:49.190+0800	INFO	registrar/registrar.go:110	Loading registrar data from /opt/filebeat-6.2.4/data/registry
2020-06-13T07:06:49.190+0800	INFO	registrar/registrar.go:121	States Loaded from registrar: 0
2020-06-13T07:06:49.190+0800	WARN	beater/filebeat.go:261	Filebeat is unable to load the Ingest Node pipelines for the configured modules because the Elasticsearch output is not configured/enabled. If you have already loaded the Ingest Node pipelines or are using Logstash pipelines, you can ignore this warning.
2020-06-13T07:06:49.190+0800	INFO	crawler/crawler.go:48	Loading Prospectors: 1
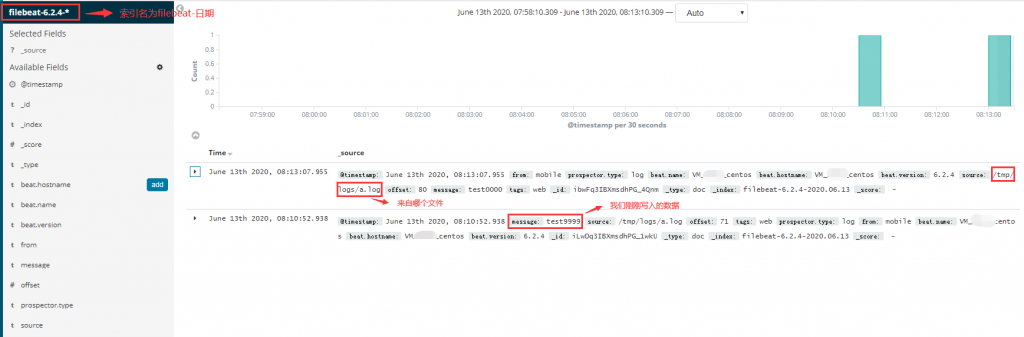
2020-06-13T07:06:49.190+0800	INFO	log/prospector.go:111	Configured paths: [/tmp/logs/*.log]
2020-06-13T07:06:49.190+0800	INFO	crawler/crawler.go:82	Loading and starting Prospectors completed. Enabled prospectors: 1
2020-06-13T07:06:49.190+0800	INFO	[monitoring]	log/log.go:97	Starting metrics logging every 30s
2020-06-13T07:06:49.191+0800	INFO	log/harvester.go:216	Harvester started for file: /tmp/logs/a.log

#Harvester started for files: /tmp/logs/a.log 表示已经感知到我们设置的log文件
现在我们往a.log里写内容
[root@VM_IP_centos logs]# echo "hello" >> a.log

终端输出:
{
  "@timestamp": "2020-06-12T23:08:14.192Z",
  "@metadata": {
    "beat": "filebeat",
    "type": "doc",
    "version": "6.2.4"
  },
  "message": "hello",
  "prospector": {
    "type": "log"
  },
  "beat": {
    "name": "VM_IP_centos",
    "hostname": "VM_IP_centos",
    "version": "6.2.4"
  },
  "source": "/tmp/logs/a.log",
  "offset": 6
}
  • Filebeat 自定义tag:
filebeat.prospectors:
- type: log
  enabled: true
  paths:
    - /tmp/logs/*.log
  tags: "web"
output.console:
  pretty: true
  enable: true

echo "test2366666" >> a.log
{
  "@timestamp": "2020-06-12T23:35:31.364Z",
  "@metadata": {
    "beat": "filebeat",
    "type": "doc",
    "version": "6.2.4"
  },
  "source": "/tmp/logs/a.log",
  "offset": 40,
  "message": "test2366666",
  "tags": [
    "web"
  ],  #多一个tag字段,这样的话,可以用来给日志打标签
  "prospector": {
    "type": "log"
  },
  "beat": {
    "name": "VM_16_5_centos",
    "hostname": "VM_16_5_centos",
    "version": "6.2.4"
  }
}
  • 设置自定义字段
filebeat.prospectors:
- type: log
  enabled: true
  paths:
    - /tmp/logs/*.log
  tags: "web"
  fields:
    from: "mobile" #关键在这里
output.console:
  pretty: true
  enable: true
{
  "@timestamp": "2020-06-12T23:52:12.102Z",
  "@metadata": {
    "beat": "filebeat",
    "type": "doc",
    "version": "6.2.4"
  },
  "offset": 54,
  "message": "test777777777",
  "tags": [
    "web"
  ],
  "prospector": {
    "type": "log"
  },
  "fields": {
    "from": "mobile" #效果
  },
  "beat": {
    "version": "6.2.4",
    "name": "VM_16_5_centos",
    "hostname": "VM_16_5_centos"
  },
  "source": "/tmp/logs/a.log"
}
filebeat.prospectors:
- type: log
  enabled: true
  paths:
    - /tmp/logs/*.log
  tags: "web"
  fields:
    from: "mobile"
  fields_under_root: true #自定乐字段挂在根节点
output.console:
  pretty: true
  enable: true
{
  "@timestamp": "2020-06-12T23:54:04.997Z",
  "@metadata": {
    "beat": "filebeat",
    "type": "doc",
    "version": "6.2.4"
  },
  "message": "test888",
  "source": "/tmp/logs/a.log",
  "tags": [
    "web"
  ],
  "prospector": {
    "type": "log"
  },
  "from": "mobile", #效果
  "beat": {
    "name": "VM_16_5_centos",
    "hostname": "VM_16_5_centos",
    "version": "6.2.4"
  },
  "offset": 62
}
filebeat.prospectors:
- type: log
  enabled: true
  paths:
    - /tmp/logs/*.log
  tags: "web"
  fields:
    from: "mobile"
  fields_under_root: true
setup.template.setting:
  index.number_of_shards: 3 #索引的分片数
output.elasticsearch: #关键--输出到es
  hosts: ["es_ip:9200"]
  • 再次启动filebeat
[root@VM_IP_centos filebeat-6.2.4]# ./filebeat -e -c test.yml 
2020-06-13T08:10:11.886+0800	INFO	instance/beat.go:468	Home path: [/opt/filebeat-6.2.4] Config path: [/opt/filebeat-6.2.4] Data path: [/opt/filebeat-6.2.4/data] Logs path: [/opt/filebeat-6.2.4/logs]
2020-06-13T08:10:11.889+0800	INFO	instance/beat.go:475	Beat UUID: d29dba4a-be63-483a-8d15-35d78f1fa68e
2020-06-13T08:10:11.889+0800	INFO	instance/beat.go:213	Setup Beat: filebeat; Version: 6.2.4
2020-06-13T08:10:11.889+0800	INFO	elasticsearch/client.go:145	Elasticsearch url: http://es_ip:9200 #这里表示已经设置写入es成功
2020-06-13T08:10:11.890+0800	INFO	pipeline/module.go:76	Beat name: VM_16_5_centos
2020-06-13T08:10:11.904+0800	INFO	instance/beat.go:301	filebeat start running.
2020-06-13T08:10:11.904+0800	INFO	registrar/registrar.go:110	Loading registrar data from /opt/filebeat-6.2.4/data/registry
2020-06-13T08:10:11.905+0800	INFO	registrar/registrar.go:121	States Loaded from registrar: 1
2020-06-13T08:10:11.905+0800	INFO	crawler/crawler.go:48	Loading Prospectors: 1
2020-06-13T08:10:11.905+0800	INFO	[monitoring]	log/log.go:97	Starting metrics logging every 30s
2020-06-13T08:10:11.911+0800	INFO	log/prospector.go:111	Configured paths: [/tmp/logs/*.log]
2020-06-13T08:10:11.911+0800	INFO	crawler/crawler.go:82	Loading and starting Prospectors completed. Enabled prospectors:
  • 我们来接着写一条:
[root@VM_IP_centos logs]# echo "test9999" >> a.log
  • 我们可以通过kibana来查看
kibana展示结果
  • 最后我们来说说Filebeat的工作原理:

Filebeat由两个主要组件组成:prospector(探测器)和havester(收割机)

  • prospector:

1.prospector负责管理havester并找到所有要读取的文件来源
2.如果输入类型为日志,则查找器将查找路径匹配的所有文件,并为每个文件启支一个harvestor
3.filebeat目前支持两种prospector类型:log和stdin

  • havester: (文章前面我们有介绍,可以看下上面的内容)

1.负责读取单个文件内容
2.如果文件在读取时被删除或重命名,filebeat将继续读取文件

  • Filebeat如何保持文件的状态(从哪行日志开始读)

1.Filebeat保存每个文件的状态并经常将状态刷新到磁盘上的注册文件中
2.该状态用于记住havester正在读取的最后偏移量,并确保发送所有日志行
3.如果输出无法访问,filebeat会跟踪最后发送的行,并在输出再次可用时继续读取文件
4.在Filebeat运行时,每个prospector内存中也会保存的文件状态信息,当重新启动filebeat时,将使用注册文件的数据来重建文件状态,filebeat将每个havestor在从保存的最后偏移量继续读取

文件的状态保存在哪呢?

/opt/filebeat-6.2.4/data #filebeat的data目录下
vim registry
[{"source":"/tmp/logs/a.log","offset":80,"timestamp":"2020-06-13T08:18:13.030292935+08:00","ttl":-1,"type":"log","FileStateOS":{"inode":894391,"device":64769}}

#offset表示偏移量
  • Module的使用,这部分暂时略,后续再写一篇相关的文章

ES(elasticsearch)学习笔记–安装

  • 概念:学任何东西之前,先了解下它是什么,它能做什么?

维基百科上的解释:Elasticsearch是一个基于Lucene库的搜索引擎。它提供了一个分布式、支持多租户的全文搜索引擎,具有HTTP Web接口和无模式JSON文档。Elasticsearch是用Java开发的,并在Apache许可证下作为开源软件发布。官方客户端在Java、.NET(C#)、PHP、Python、Apache Groovy、Ruby和许多其他语言中都是可用的。根据DB-Engines的排名显示,Elasticsearch是最受欢迎的企业搜索引擎,其次是Apache Solr,也是基于Lucene,主要作用:它可以快速地储存、搜索和分析海量数据。维基百科、Stack Overflow、Github 都采用它,还可以存储一些日志,比如binlog, accesslog, 监控日志等,便于快速检索和定位问题

  • 目前最新版本是哪个版本?

目前版本是:7.7.1 (2020-06-09),下载地址: https://www.elastic.co/cn/downloads/elasticsearch

  • 历史版本下载:

https://www.elastic.co/cn/downloads/past-releases#elasticsearch

  • 我选择的版本

这里选择的是elasticsearch-6.2.4,原因是我看的教程目前是这个版本的,下次有时间会找个最新版的来写篇教程。学习东西都差不多,触类旁通

  • 安装步骤

Elastic 需要 Java 8 环境。如果你的机器还没安装 Java,请选安装java,linux 下java安装很简单,注意要保证环境变量JAVA_HOME正确设置,设置java home的方法如下:

//假设java安装目录在/usr/java
JAVA_HOME=/usr/java/jdk
JRE_HOME=/usr/java/jdk/jre
CLASS_PATH=.:$JAVA_HOME/lib/dt.jar:$JAVA_HOME/lib/tools.jar:$JRE_HOME/lib
PATH=$PATH:$JAVA_HOME/bin:$JRE_HOME/bin
OPENSSL_CONF=/etc/pki/tls/openssl.cnf
export JAVA_HOME JRE_HOME CLASS_PATH PATH

//以上配置可以写在/etc/profile,或是~/.bashrc中
生效可以使用source /etc/profile, 或是source ~/.bashrc
$ wget https://artifacts.elastic.co/downloads/elasticsearch/elasticsearch-6.2.4.zip
$ unzip elasticsearch-6.2.4.zip
$ cd elasticsearch-6.2.4/ 
  • 启动elasticsearch,假设我的解压目录在/opt下
/opt/elasticsearch-6.2.4/bin/elasticsearch
  • 排坑指南

(1) can not run elasticsearch as root

这个问题的关键是elasticsearch为了安全不允许以root身份运行

#建立单独的用户组和用户
groupadd esgroup
useradd esuser -g esgroup -p 123456
chown -R esuser:esgroup /opt/elasticsearch-6.2.4

(2) ERROR: [2] bootstrap checks failed
[1]: max number of threads [3881] for user [esuser] is too low, increase to at least [4096]
[2]: max virtual memory areas vm.max_map_count [65530] is too low, increase to at least [262144]

#解决方案
vim /etc/security/limits.d/20-nproc.conf
*          soft    nproc     4096
*          hard    nproc     4096
//或者将*号改成esuser
//是否生效与否,可以切esuser,然后ulimit -a查看"max user processes"是否达到4096

在/etc/sysctl.conf添加vm.max_map_count
echo "vm.max_map_count=262144" > /etc/sysctl.conf
sysctl -p
  • 排完坑之后,/opt/elasticsearch-6.2.4/bin/elasticsearch
启动成功
  • 验证
[root@VM_IP_centos bin]# curl IP:9200
{
  "name" : "HnNnFni",
  "cluster_name" : "elasticsearch",
  "cluster_uuid" : "p96Hsjp8ROylQSq-AI32Jg",
  "version" : {
    "number" : "6.2.4",
    "build_hash" : "ccec39f",
    "build_date" : "2018-04-12T20:37:28.497551Z",
    "build_snapshot" : false,
    "lucene_version" : "7.2.1",
    "minimum_wire_compatibility_version" : "5.6.0",
    "minimum_index_compatibility_version" : "5.0.0"
  },
  "tagline" : "You Know, for Search"
}
  • Elasticsearch network.host 设置外网访问es
cd /opt/elasticsearch-6.2.4/config/
vim elasticsearch.yml

network.host: xx.xx.xx.xx(自己的ip)
#
# Set a custom port for HTTP:
#
http.port: 9200
  • 防火墙安全策略设置9200端口可访问
验证外网访问是否ok

接着我们安装kibana,先了解下kibana是什么?

Kibana是一个开源的分析和可视化平台,设计用于和Elasticsearch一起工作。可以用Kibana来搜索,查看,并和存储在Elasticsearch索引中的数据进行交互。执行高级数据分析,并且以各种图标、表格和地图的形式可视化数据。Kibana使得理解大量数据变得很容易。它简单的、基于浏览器的界面使你能够快速创建和共享动态仪表板,实时显示Elasticsearch查询的变化。

  • 具体安装

下载kibana: https://www.elastic.co/cn/downloads/past-releases#kibana,选择kibana-6.2.4,与es版本保持一致

#假设kibana-6.2.4-linux-x86_64.tar.gz在/opt下
cd /opt
tar -xvzf kibana-6.2.4-linux-x86_64.tar.gz
mkdir -p /usr/local/kibana
mv /opt/kibana-6.2.4-linux-x86_64/* /usr/local/kibana/
  • 修改kibana配置
cd /usr/local/kibana/config/
vim kibana.yml

//修改以下两个选项
server.host: "IP"
elasticsearch.url: "http://IP:9200/"  #es的ip
  • kibana启动,启动前,先放开防火墙的5601端口访问限制
/usr/local/kibana/bin/kibana
Kibana启动

出现Ready,说明启动成功

  • kibana验证
Kibana UI界面